Outside reversal patterns are a crucial tool in technical analysis, signaling potential shifts in market direction over a two-day period. These patterns manifest when the current day's price movement completely covers the previous day's trading range, hinting at a significant change in market sentiment. Depending on whether the market is trending up or down, these reversals can be classified as either bullish or bearish. While providing precise indications, expert traders often combine outside reversals with additional technical data, such as trading volume or support and resistance levels, to enhance the reliability of their trading decisions. This integrated approach helps in distinguishing strong reversal signals from less significant price fluctuations.
Understanding both bullish and bearish outside reversal patterns is essential for effective market analysis. A bullish outside reversal typically appears after a downtrend, where a security initially falls but then dramatically rises to close higher than the previous day's high, suggesting that buying pressure has overcome selling pressure. Conversely, a bearish outside reversal occurs after an uptrend, with the security opening higher but then falling sharply to close below the previous day's low, indicating that sellers have gained dominance. Recognizing these patterns, especially when supported by other market indicators, allows traders to anticipate trend changes and adjust their strategies accordingly, making them valuable components of a comprehensive trading methodology.
The Dynamics of Outside Reversal Patterns
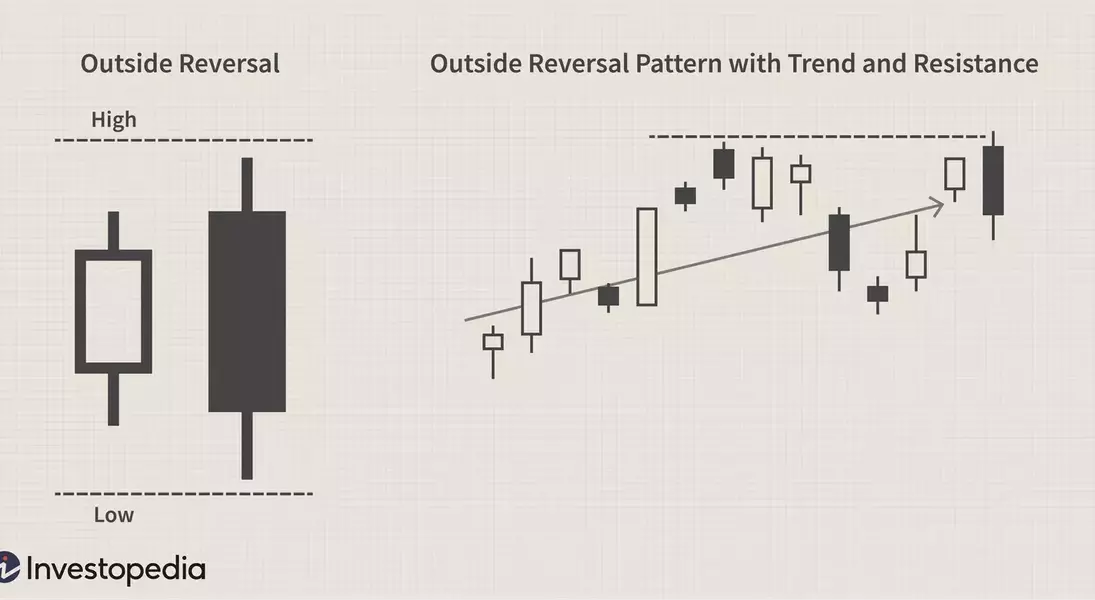
Outside reversal patterns are dynamic two-day formations on price charts that indicate a potential change in market direction for a security. This occurs when the current day’s trading activity spans a wider range, with both its high and low prices exceeding the previous day's respective high and low. Such a comprehensive price movement suggests a strong shift in market sentiment within a short period. Technical analysts consider these patterns to be quite precise, offering insights into whether a market is poised for an upward (bullish) or downward (bearish) movement. By capturing the full scope of prior day's price action, outside reversals provide a clear visual cue that the prevailing trend might be losing momentum and a new direction is emerging.
A thorough examination of outside reversal patterns reveals their utility in predicting market shifts. These patterns are particularly effective when combined with other forms of market analysis, such as volume trends, and established support and resistance levels. For instance, a bearish outside reversal occurring near a resistance level with high trading volume can be a much stronger signal than a similar pattern in a sideways market with low volume. This integrative approach helps traders confirm the validity of the reversal signal, preventing misinterpretations. Recognizing these patterns in conjunction with broader market context allows for more informed decision-making, as traders can anticipate and respond to significant changes in a security’s price trend with greater confidence.
Identifying Bullish and Bearish Trend Changes
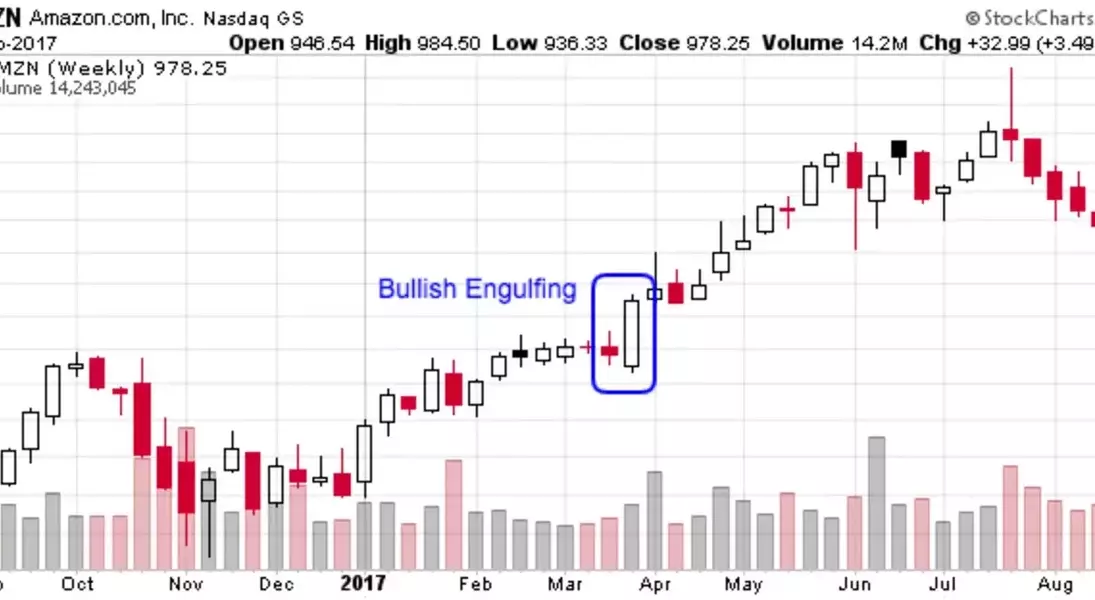
Identifying bullish outside reversal patterns involves recognizing specific market behaviors where buyers overcome sellers after a period of decline. This pattern manifests when a security's price initially drops, even opening lower than the previous day, but then rallies strongly to close significantly higher. This decisive move indicates that the initial control held by sellers (bears) has been decisively taken over by buyers (bulls), signaling a robust potential for an upward trend reversal. Observing such a pattern suggests a shift in market momentum, where positive sentiment begins to dominate, prompting traders to consider long positions in anticipation of continued price appreciation.
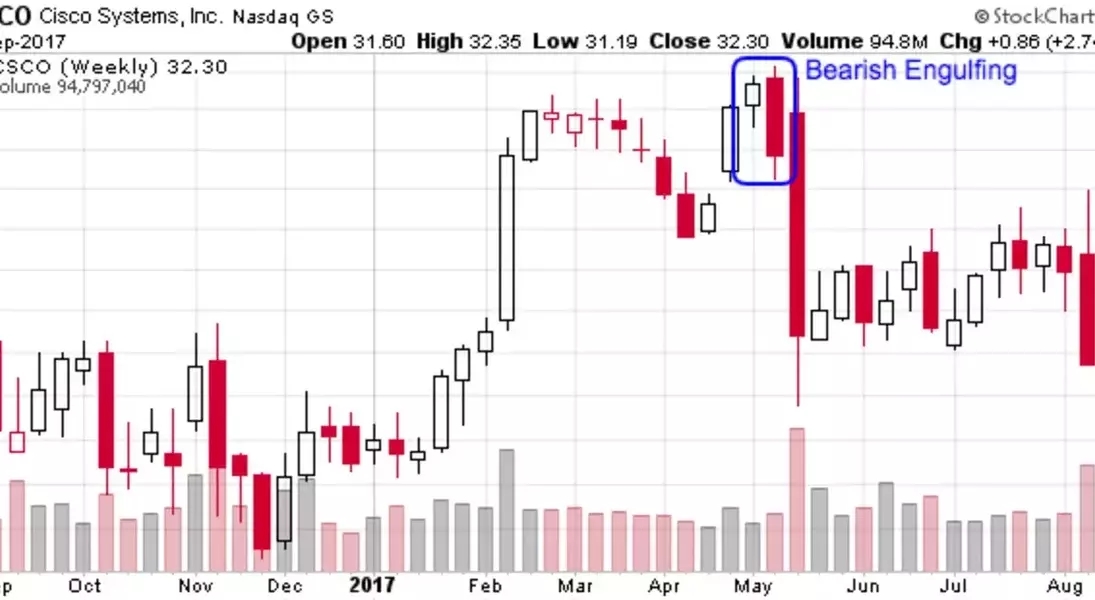
Conversely, recognizing bearish outside reversal patterns is crucial for anticipating downward trend shifts. This pattern occurs when a security, after an upward trend, opens higher but then experiences a sharp decline, closing well below the previous day's low. This abrupt reversal signifies that the bullish momentum has been overtaken by selling pressure, as sellers decisively gain control from buyers. Such a strong indication of a shift from positive to negative market sentiment often leads traders to consider short positions or exit existing long positions, preparing for a potential downtrend. Both bullish and bearish outside reversals serve as powerful indicators for traders to adjust their strategies in response to significant changes in market direction.