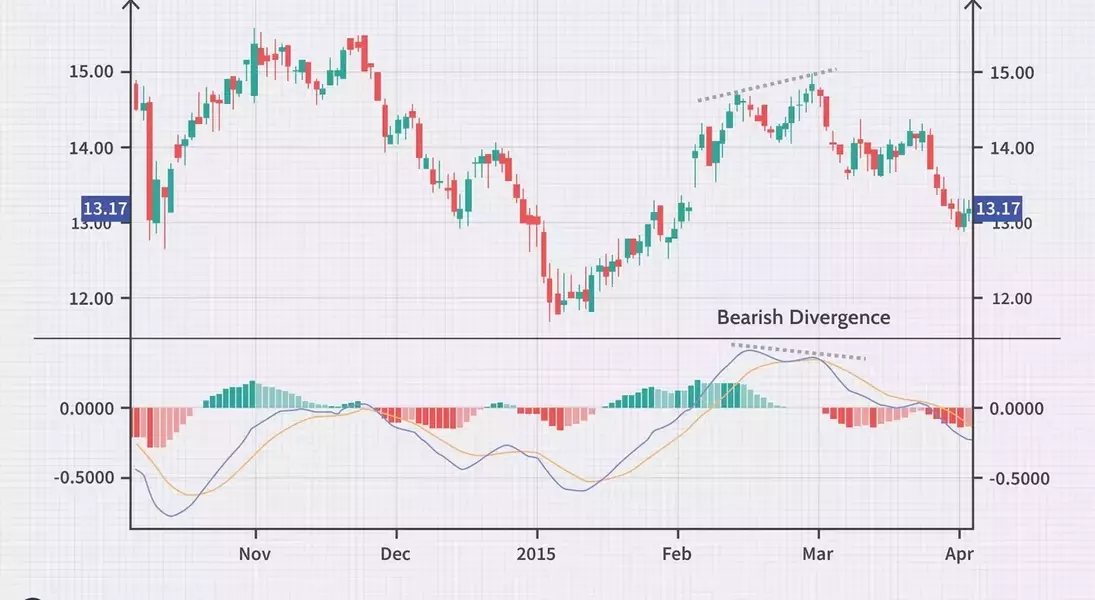
The Moving Average Convergence Divergence (MACD) indicator is a fundamental tool in technical analysis, widely utilized to identify market trends, gauge momentum, and pinpoint potential entry and exit points for trading various securities. Developed by Gerald Appel in the 1970s, MACD remains a cornerstone for traders seeking to understand market dynamics and make informed decisions.
Unlock Market Secrets with MACD: Your Guide to Smarter Trading!
Understanding the Core Principles of MACD for Effective Trading
The Moving Average Convergence/Divergence (MACD) is a dynamic technical indicator essential for traders. It assesses an asset's momentum by analyzing the relationship between two exponential moving averages (EMAs) of its price. This tool assists in identifying price trends, measuring their intensity, and recognizing optimal buy or sell opportunities.
Decoding MACD Signals: Entry and Exit Strategies for Traders
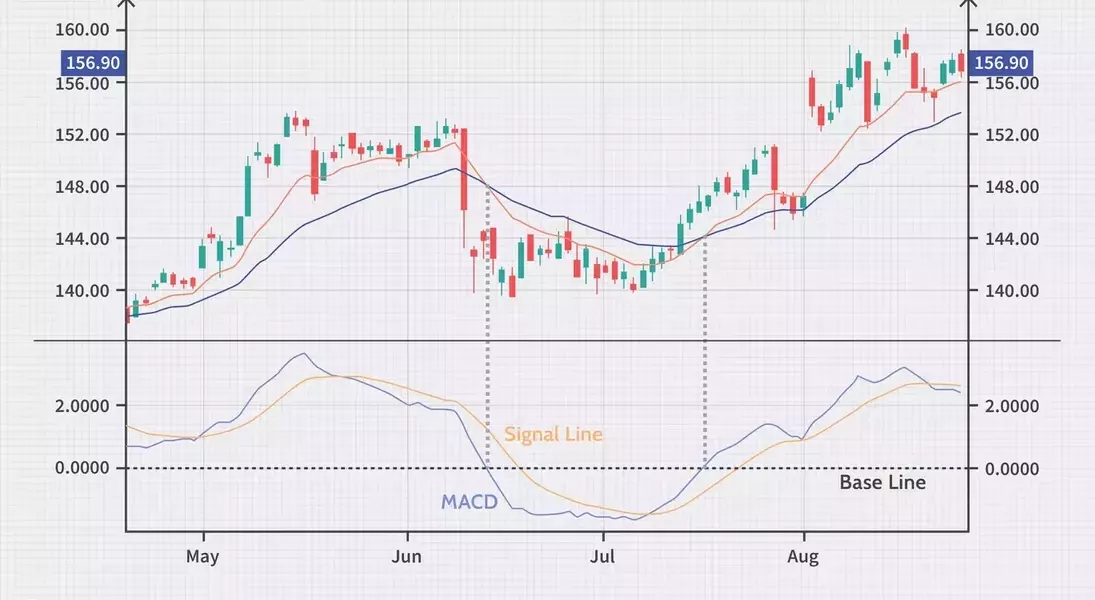
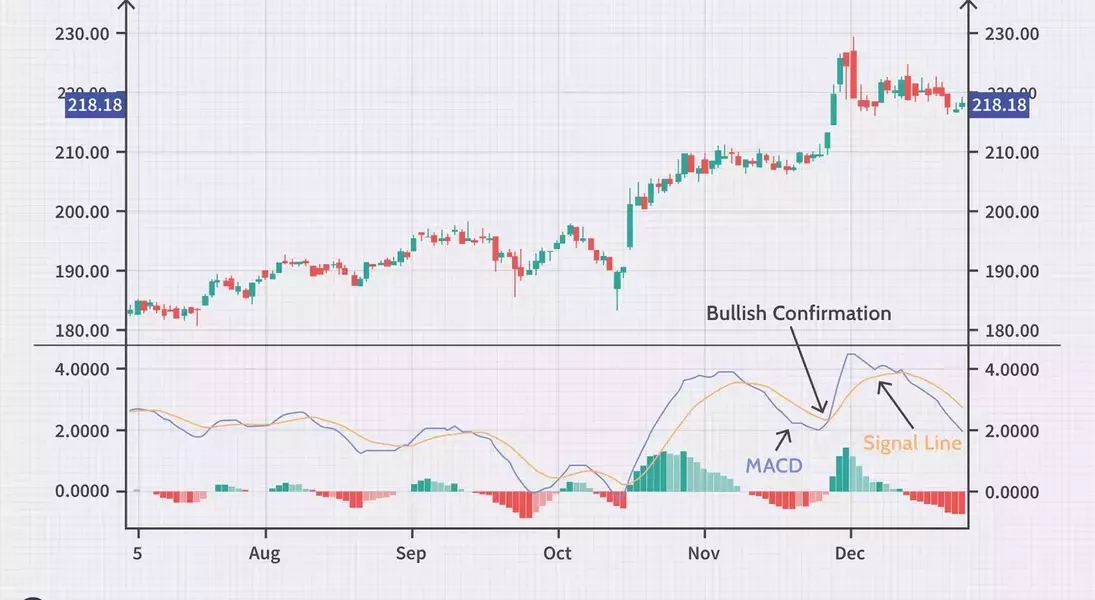
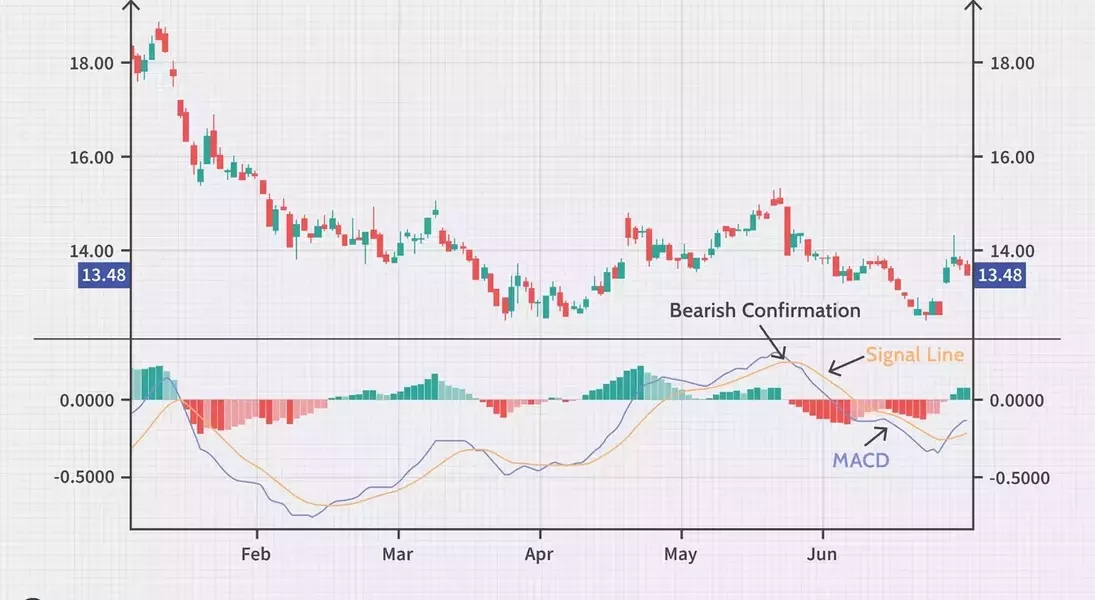
The MACD line is derived by subtracting the 26-period Exponential Moving Average (EMA) from the 12-period EMA. A nine-period EMA of this MACD line, known as the signal line, is plotted alongside it. This signal line acts as a critical trigger for generating buy or sell signals. Traders typically consider buying when the MACD line ascends above the signal line and selling (or shorting) when it descends below. MACD signals can be interpreted through three primary methods: crossovers, divergences, and rapid price shifts.
The Mathematical Foundation: Calculating the MACD Indicator
The MACD is calculated using a straightforward formula: MACD = (12-Period EMA) - (26-Period EMA). An Exponential Moving Average (EMA) differs from a Simple Moving Average (SMA) by assigning greater weight to more recent price data, making it more responsive to current market changes. This responsiveness is crucial for traders who rely on timely data to make quick decisions. It is important to note that EMAs, particularly weighted ones, exhibit more significant reactions to recent price movements compared to SMAs.
Practical Applications: Interpreting MACD for Trading Decisions
The MACD indicator is visually represented with a positive value (often a blue line) when the 12-period EMA (red line on the price chart) is above the 26-period EMA (blue line on the price chart), and a negative value when the 12-period EMA is below. The distance between the MACD line and its baseline reflects the spread between the two EMAs. As illustrated in the charts, fluctuations in MACD values directly correspond to the movements of these EMA lines, providing clear visual cues for market analysis.
Visualizing Momentum: The Role of the MACD Histogram
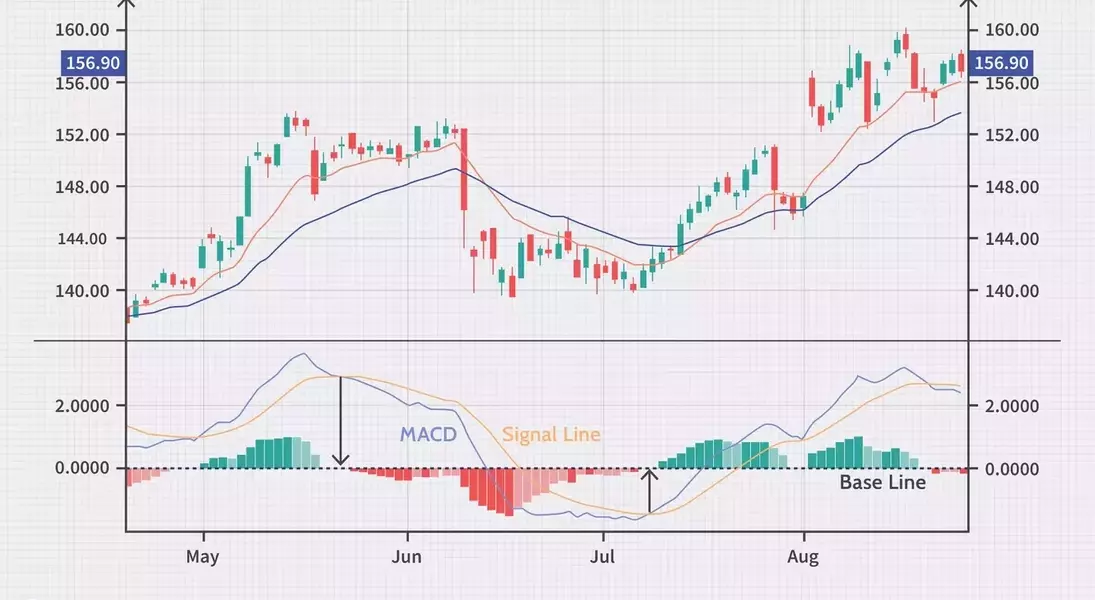
The MACD is frequently accompanied by a histogram, which graphically illustrates the distance between the MACD line and its signal line. When the MACD is above its signal line, the histogram bars appear above the zero line (or baseline), indicating bullish momentum. Conversely, when the MACD is below its signal line, the histogram bars are below the baseline, signaling bearish momentum. Traders leverage the MACD histogram to identify peaks in bullish or bearish activity and to generate signals for overbought or oversold conditions.
MACD vs. RSI: Distinguishing Momentum and Overbought/Oversold Conditions
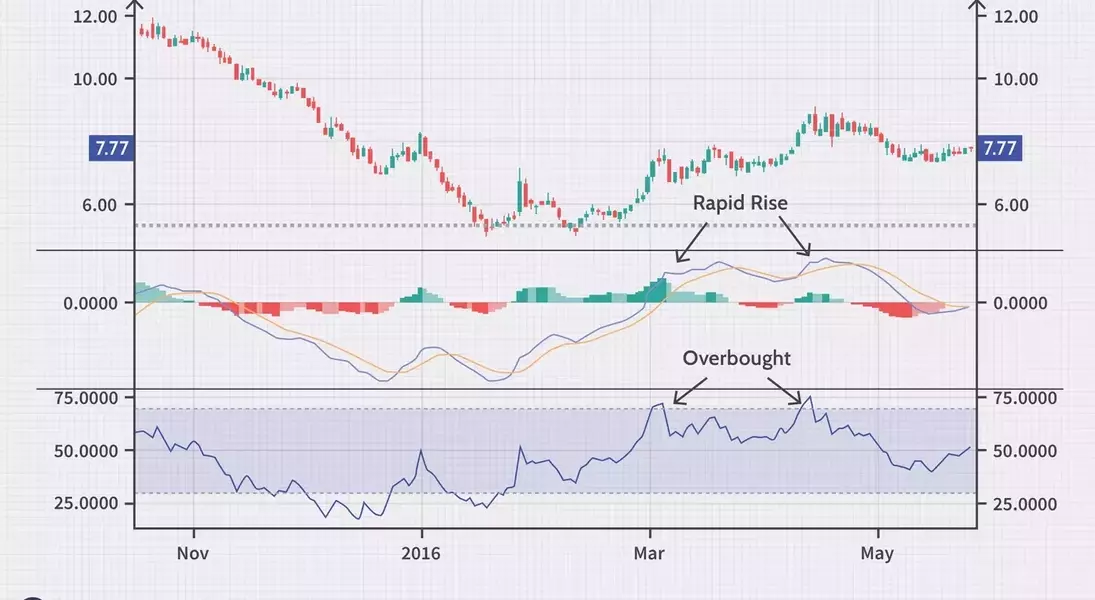
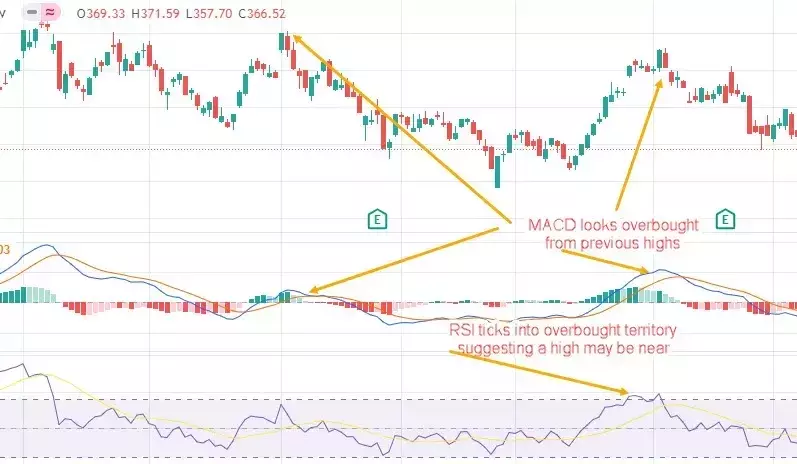
While both MACD and the Relative Strength Index (RSI) are momentum indicators, they measure different aspects of market dynamics. The RSI signals whether an asset is overbought or oversold based on recent price action, with values ranging from 0 to 100. A reading above 70 suggests overbought conditions, while below 30 indicates oversold conditions. In contrast, MACD lines do not have fixed overbought/oversold levels; instead, they operate on a relative basis, requiring traders to compare current MACD and signal line levels with past price movements. These indicators are often used in tandem to provide a more comprehensive technical overview, as they can sometimes offer conflicting signals, highlighting the need for a nuanced approach.
Understanding MACD's Limitations: Avoiding False Signals
Despite its utility, MACD has limitations, particularly its tendency to produce "false positives" during market consolidations. When an asset's price moves sideways, MACD may gravitate towards the zero line, signaling a potential reversal even if a true trend change is not occurring. To mitigate this, traders often seek confirmation from trend-following indicators like the Directional Movement Index (DMI) system, particularly the Average Directional Index (ADX), which indicates the strength of a trend. A high ADX reading confirms a trend, helping traders distinguish genuine signals from false ones. For example, a bearish MACD divergence should be cross-referenced with the ADX to avoid premature trades if an uptrend is still strong.
Navigating Market Changes: Interpreting MACD Crossovers
MACD crossovers are crucial signals for traders. A bearish signal, indicating a potential selling opportunity, occurs when the MACD line crosses below the signal line. Conversely, a bullish signal, suggesting upward momentum, is generated when the MACD line crosses above the signal line. These crossovers are most reliable when they align with the prevailing market trend. For instance, a MACD crossing above its signal line during a brief correction within a long-term uptrend provides bullish confirmation. Similarly, a crossover below the signal line during a short-term rally within a broader downtrend confirms bearish sentiment.
Identifying Turning Points: The Significance of MACD Divergence
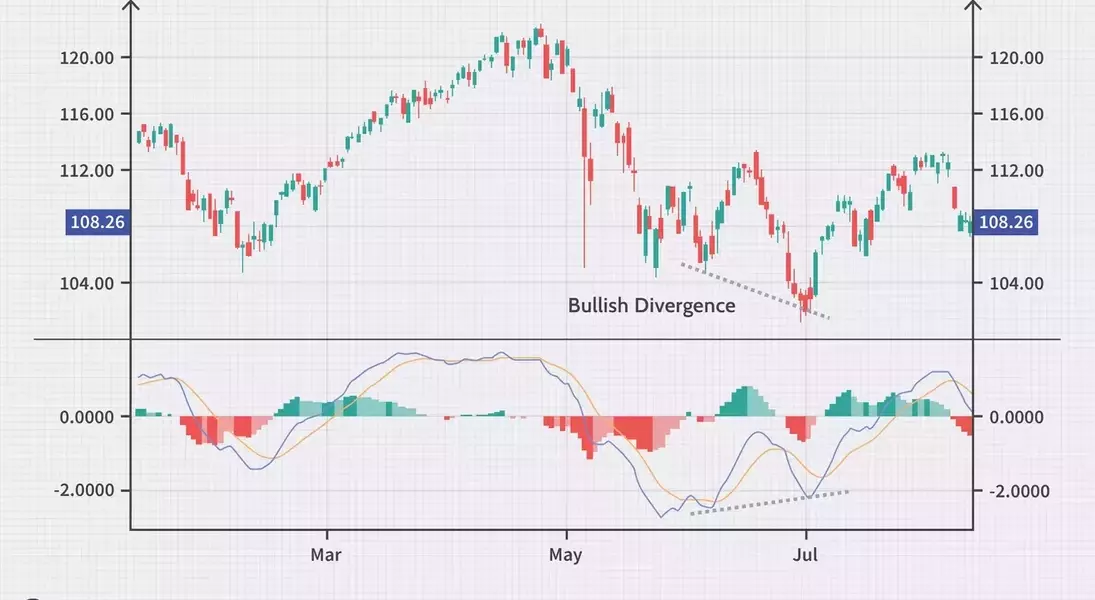
MACD divergence occurs when the indicator's highs or lows do not align with the corresponding highs or lows of the asset's price. A bullish divergence, where MACD shows rising lows while the price exhibits falling lows, often signals a valid buying opportunity, especially within a positive long-term trend. Conversely, a bearish divergence, characterized by falling MACD highs coinciding with rising price highs, suggests the continuation of a long-term bearish trend or weakness in a bullish one. While less reliable for predicting trend reversals, divergences can alert traders to potential shifts in market dynamics.
Recognizing Market Extremes: Rapid Rises and Falls in MACD
When the MACD line experiences rapid upward or downward movements, it suggests that the security might be overbought or oversold and could soon revert to more normal levels. This occurs when the shorter-term moving average significantly pulls away from the longer-term moving average. Traders typically combine this analysis with other technical indicators, such as the Relative Strength Index (RSI), to confirm these overbought or oversold conditions. The MACD histogram can also be used similarly to identify positive or negative crossovers, divergences, and sharp price movements, though understanding the timing differences between these signals requires experience.
The Final Word on MACD: A Powerful Yet Complementary Tool
MACD, a moving average-based indicator, is most effective when used with daily data. A crossover of the MACD line above or below its signal line can provide clear directional signals, similar to how crossovers of short-term simple moving averages might. Due to its reliance on EMAs, MACD reacts quickly to price changes. However, as a lagging indicator, MACD signals should be confirmed by other technical tools like the RSI or candlestick charts before making trading decisions. This layered approach helps traders validate signals and manage risk effectively.