Bullish Signals Abound as Bitcoin Funding Rate Soars to Multi-Month High
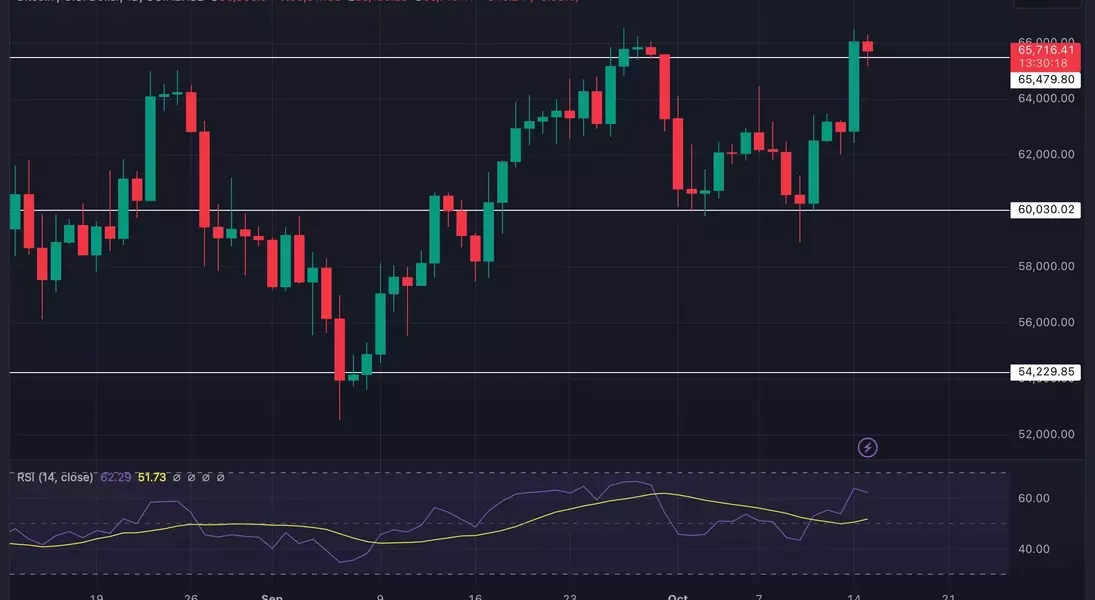
Bitcoin (BTC) has once again surpassed the $65,000 resistance level after briefly dipping below it a few days ago. This recent price uptick has sparked renewed bullish sentiment in the market, and a key metric has reached a multi-month high, further suggesting a significant increase in positive sentiment around the king coin.Riding the Wave of Bullish Momentum
Bitcoin's Price Action Reflects Investor Confidence
BTC's price action has been predominantly green over the past week, with the cryptocurrency gaining more than 4% in the last seven days. At the time of writing, the king coin is trading at $65,561.08, with a market capitalization of over $1.3 trillion. The increase in BTC's trading volume as its price surged is generally seen as a foundation for a bull rally, further bolstering the case for a continued upward trend.Futures Market Signals Bullish Sentiment
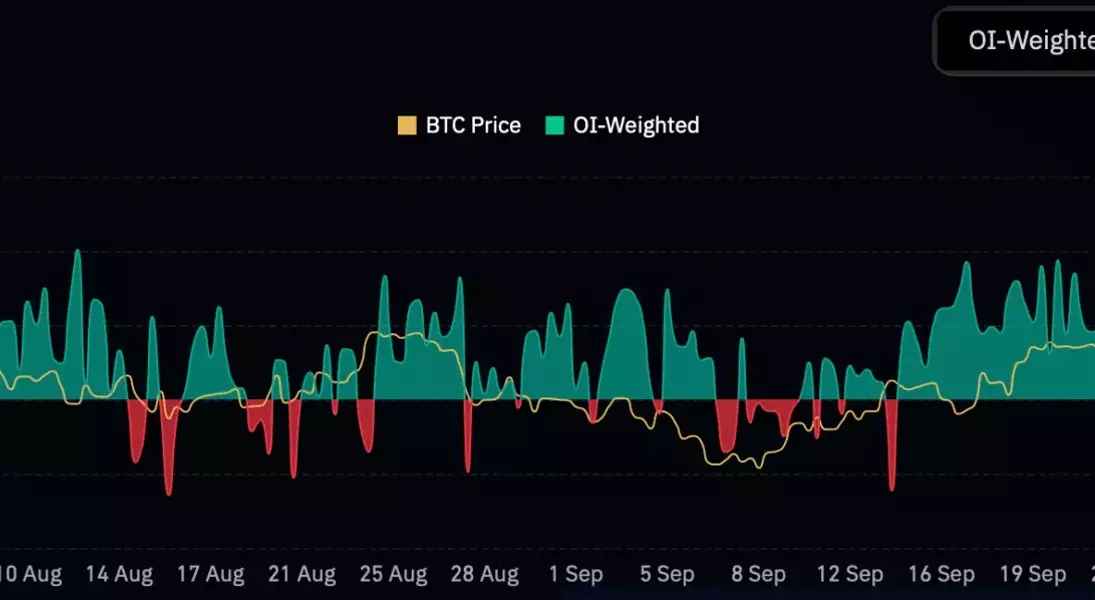
Alongside the price surge, BTC's Futures have also reached new highs, with the Funding Rate touching a multi-year high. The Funding Rate is a metric that reflects the flow of capital into the network, and a rise in this rate typically indicates an increase in bullish sentiment. Additionally, BTC's Open Interest across all exchanges has hit a new all-time high of $19.75 billion, which often signals the potential for significant price moves ahead as more capital is on the line.On-Chain Data Supports Bullish Narrative
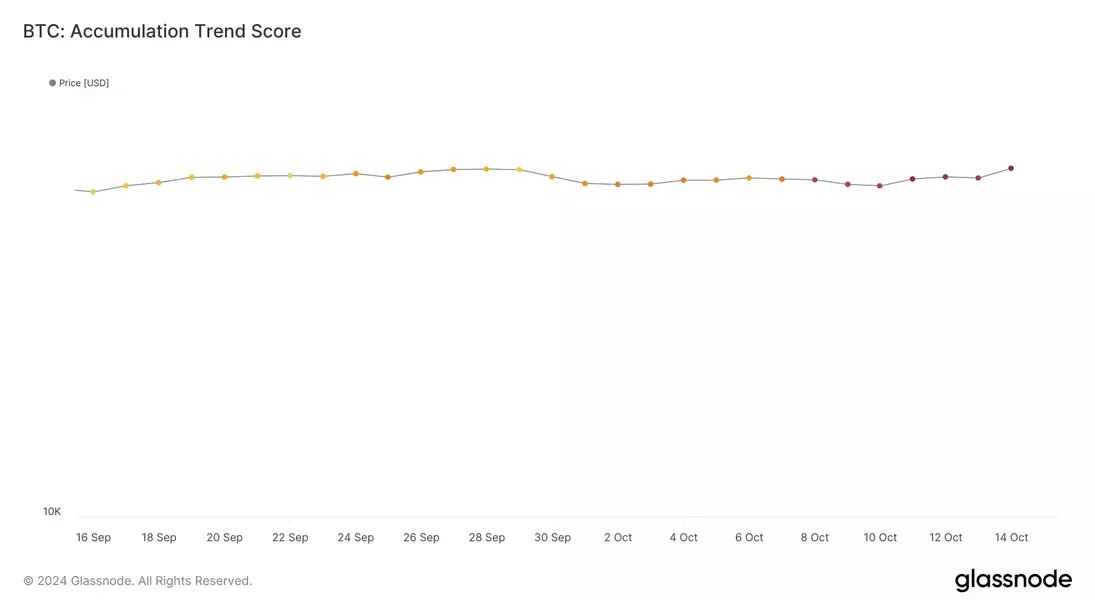
An analysis of on-chain data from Glassnode further reinforces the bullish sentiment surrounding BTC. The accumulation trend score, which reflects the relative size of entities actively accumulating coins, has increased from 0.2 in late September to 0.6 in October, indicating a rise in buying pressure.However, it's important to note that not all on-chain metrics are entirely favorable. CryptoQuant's data reveals that BTC's net deposit on exchanges has been high compared to the last seven-day average, suggesting that selling pressure has increased in the recent past. This could potentially lead to a price correction, as increased selling pressure often precedes a pullback.Technical Analysis Paints a Mixed Picture
A closer look at BTC's daily chart suggests that the cryptocurrency has turned a previous resistance level into support after breaking through it. However, the Relative Strength Index (RSI) has registered a downtick, hinting that BTC might not be able to maintain its newfound support level.Navigating the Volatility Ahead
The combination of bullish and bearish signals in the Bitcoin market suggests that investors should approach the current situation with cautious optimism. While the funding rate, open interest, and accumulation trends point to a potential continuation of the upward momentum, the increased selling pressure and technical indicators warrant close monitoring.Prudent investors would do well to closely follow the evolving market dynamics and be prepared to adjust their strategies accordingly. The road ahead may be paved with both opportunities and challenges, and a measured, data-driven approach will be crucial in navigating the volatile landscape of the Bitcoin market.You May Like


