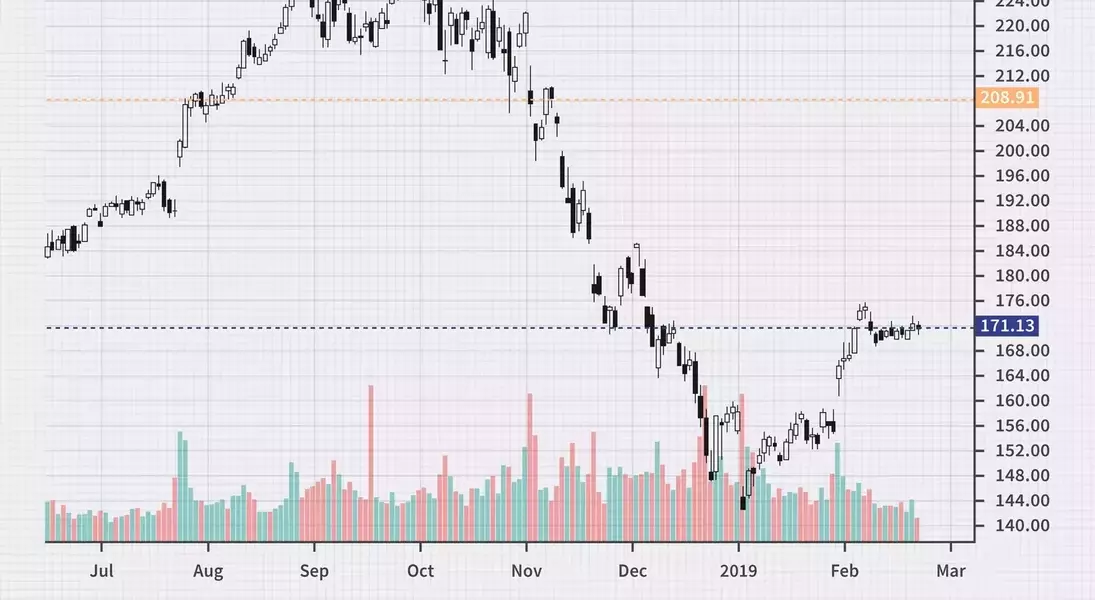
Price action serves as a fundamental aspect of technical analysis in financial markets, representing the movement of a security's value over time. Traders often rely on this raw data, plotted graphically, to identify significant market trends, detect potential breakouts, and pinpoint crucial support and resistance levels. This method encourages decision-making grounded in actual market behavior rather than speculative forecasts. While it offers a direct view of market dynamics, the interpretation of price action can be highly subjective, leading to varying conclusions among different analysts. Furthermore, insights derived from historical price movements, though valuable, do not assure future market performance, underscoring the importance of integrating it with other analytical approaches for a comprehensive trading strategy.
Understanding price action involves analyzing how market participants react to various economic and non-economic factors, capturing the collective sentiment of buyers and sellers. Traders utilize diverse charting techniques, particularly candlestick charts, which provide detailed visual cues about opening, closing, high, and low prices within specific timeframes. These visual patterns, such as the Harami cross or engulfing patterns, are crucial for anticipating future price behaviors. Beyond visual patterns, price action data is also instrumental in calculating technical indicators, which aim to uncover underlying order within seemingly random market fluctuations. This disciplined approach enables traders to enhance their strategic decisions by understanding the nuances of market psychology and momentum.
Analyzing Price Movement Patterns
Price movement, fundamentally depicted through charting over specific periods, offers vital insights into market dynamics. Traders extensively employ various chart types to sharpen their perception of emerging trends, significant price breakthroughs, and reversals in market direction. This visual interpretation is critical for identifying potential trading opportunities without solely depending on complex indicators.
Candlestick charts are particularly favored for their rich detail, illustrating the opening, closing, highest, and lowest prices for each period, which helps in visualizing bullish or bearish sessions. Formations like the Harami cross, engulfing patterns, and three white soldiers are direct manifestations of price action, offering predictive value for what might unfold next in the market. Beyond specific patterns, technical analysts integrate this direct price information into various indicators to detect underlying order amidst the market's often chaotic movements. This holistic view enables traders to formulate more robust strategies.
Implementing Price Action in Trading Methodologies
Price action is not merely a tool but the foundational data layer from which all other trading instruments are constructed. While indicators offer derived insights, price action itself provides the unadulterated narrative of market sentiment and momentum. For traders, particularly those focused on swing and trend methodologies, direct observation of price serves as the primary basis for decision-making.
These traders often sideline in-depth fundamental analysis, preferring to concentrate on support and resistance levels to foresee market shifts like breakouts or periods of consolidation. However, the efficacy of interpreting price action is also influenced by external factors, including trading volume and the duration over which price levels are established. Modern trading incorporates sophisticated algorithms that analyze past price action to predict future movements and execute trades, highlighting the data's inherent value. Despite its power, the subjective nature of price action means interpretations can vary, emphasizing the need for supplementary analysis and acknowledging that past market behavior does not guarantee future outcomes.