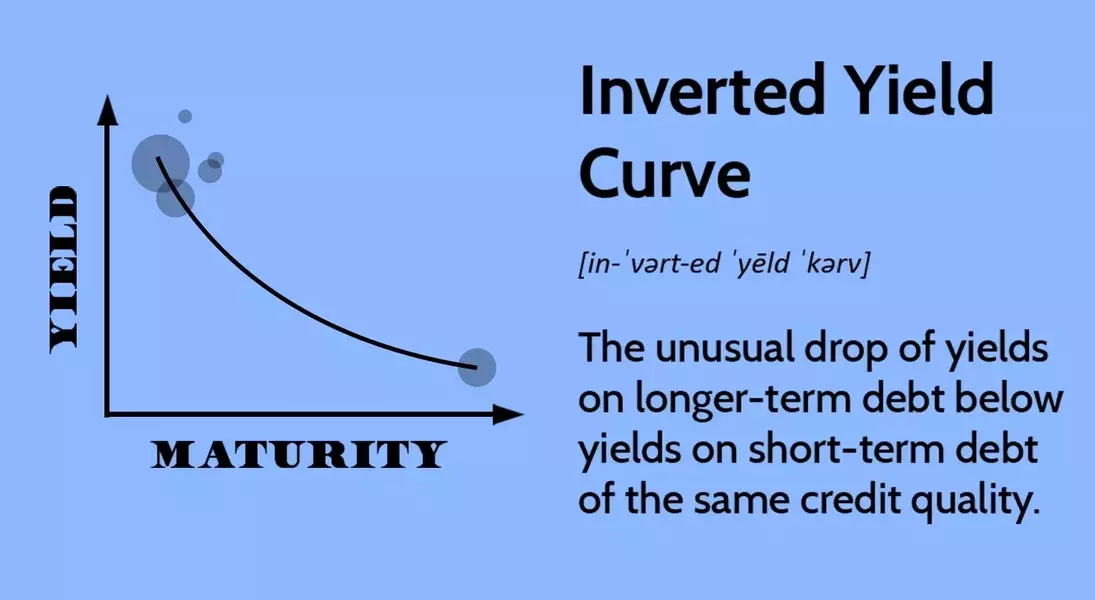
The inverted yield curve is a significant economic phenomenon that has historically served as a harbinger of impending recessions. This occurs when the returns on short-term debt instruments surpass those on long-term ones, contrary to the typical market behavior where longer maturities usually offer higher compensation for increased risk. Such an inversion indicates that investors foresee a future decline in long-term interest rates, a scenario commonly associated with economic slowdowns or contractions. The bond market's reaction, with capital shifting from short-term to long-term assets, reflects a collective pessimism regarding the near-term economic outlook. Although not a direct cause of recessions, its consistent appearance before economic downturns has made it a closely watched and debated indicator among financial analysts and policymakers.
Understanding the dynamics of the inverted yield curve is crucial for investors and economists alike. The curve, essentially a graphical representation of borrowing costs across various maturities, usually ascends, showing higher yields for longer-term commitments. However, an inversion disrupts this norm, highlighting a shift in market sentiment. This financial indicator has demonstrated a notable correlation with past recessions, prompting its careful consideration in economic forecasting. The rarity of its occurrence further amplifies its importance, drawing intense scrutiny from those aiming to decipher future economic trends and prepare for potential market shifts.
The Mechanics and Significance of Yield Curve Inversion
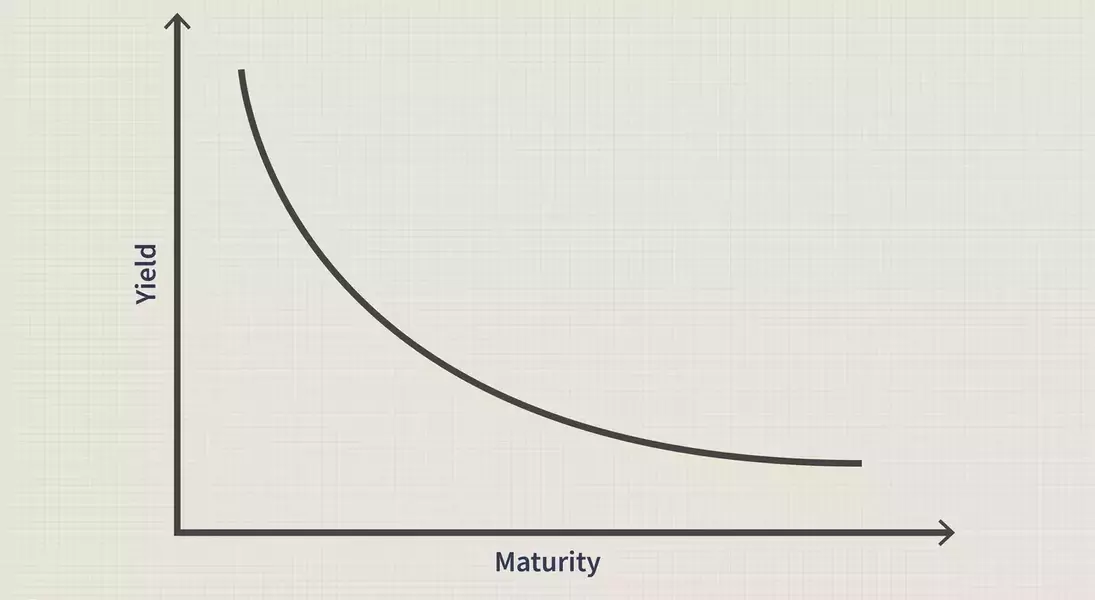
The yield curve visually demonstrates the cost of borrowing for various debt securities across different timeframes. Typically, short-term debt instruments offer lower returns than their long-term counterparts, resulting in an upward-sloping curve. This structure acknowledges that investors taking on longer commitments face greater risk and thus expect higher compensation. However, a yield curve inversion disrupts this conventional pattern, indicating that longer-term interest rates have fallen below short-term rates. This inversion signals a collective market expectation of declining interest rates in the future, a scenario often associated with impending economic slowdowns.
An inverted yield curve signals that investors are channeling their capital from shorter-term bonds into longer-term ones. This movement reflects a broader market sentiment characterized by pessimism regarding the near-term economic outlook. Historically, such inversions have consistently preceded economic recessions, making them a key indicator for financial market participants. The infrequent nature of these inversions, combined with their predictive power, commands significant attention from analysts striving to forecast economic contractions. Various measures of spread, such as the difference between 10-year and 3-month Treasury yields, are commonly used to assess the extent and implications of an inversion, providing crucial insights into market expectations for future economic performance.
Historical Context and Predictive Power of Inverted Yield Curves
Historically, the spread between the 10-year and 2-year U.S. Treasury yields has been a remarkably consistent indicator of forthcoming recessions, albeit with a notable false positive in the mid-1960s. Despite this strong historical correlation, economic officials have at times downplayed its predictive reliability. For instance, in 1998, a brief inversion occurred following Russia's debt default, but rapid interest rate adjustments by the Federal Reserve successfully averted a U.S. recession. Conversely, a sustained inversion in 2006 signaled the onset of the Great Recession in December 2007, demonstrating long-term Treasury bonds outperforming stocks.
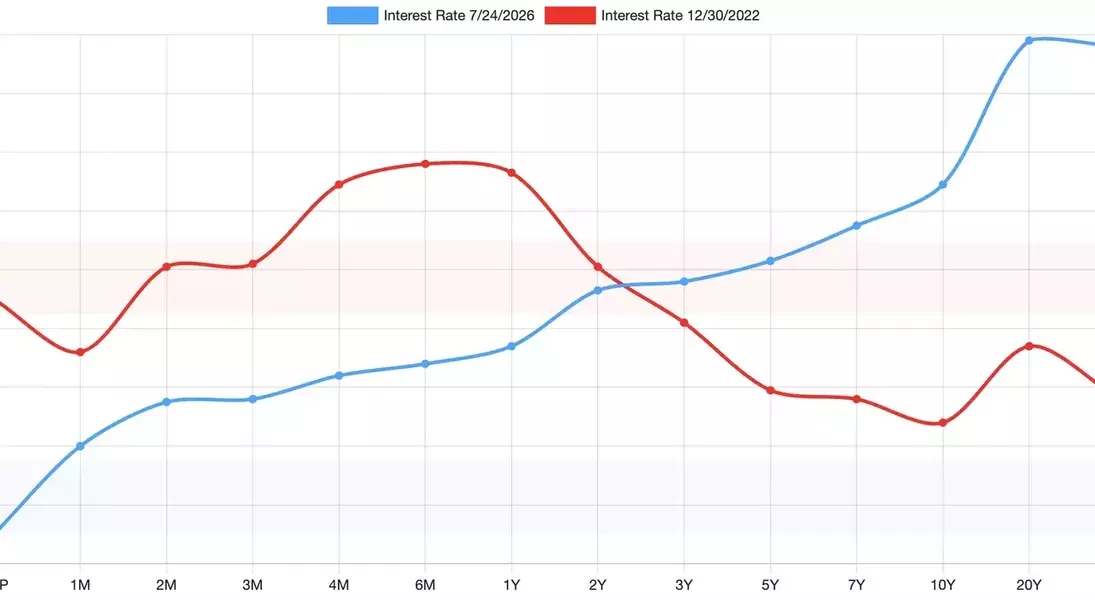
More recently, the 10-year/2-year spread inverted in August 2019, preceding the brief recession in February and March 2020 induced by the COVID-19 pandemic. Although the pandemic's impact was unforeseen at the time of the inversion, the correlation remained. By the end of 2022, facing escalating inflation, the yield curve inverted once more, with the 10-year yield at 3.88% and the 2-year yield at 4.41%, creating a 53-basis point negative spread. However, by July 24, 2026, the curve had normalized, with the 10-year Treasury rate surpassing the 2-year yield by 36 basis points. This historical review underscores that while an inverted curve often precedes recessions, it does not cause them; rather, it reflects investors' expectations of future economic downturns and the associated decline in long-term yields.