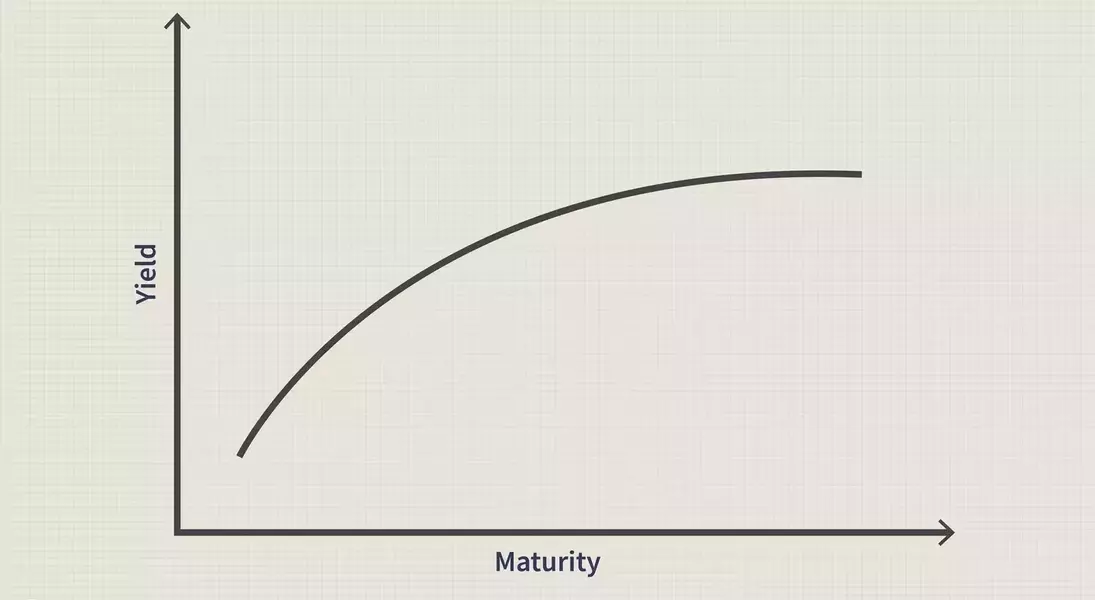
A flat yield curve, where the returns on short-term and long-term bonds are strikingly similar, often acts as a barometer for economic sentiment, frequently signaling anticipated slower growth or heightened uncertainty. This article explores the intricacies of such a curve, delving into its implications for financial markets, the role of central banks, and potential strategies for investors.
The Flat Yield Curve: A Signal of Economic Shifts
In the realm of financial markets, a flat yield curve emerges when the yields offered on debt instruments with varying maturities—from short-term notes to long-term bonds—become remarkably similar. This alignment suggests that investors do not perceive significant additional compensation for the extended risk or opportunity cost associated with holding longer-duration assets. Historically, this convergence has been a precursor to periods of economic deceleration or uncertainty.
A compelling example of this pattern can be observed in U.S. Treasury bonds. Consider a scenario where a two-year Treasury bond yields 5%, while a 30-year Treasury bond offers a mere 5.1%. The marginal difference in return provides little incentive for investors to lock up their capital for an extended period, reflecting a cautious outlook on future economic performance.
The flattening of the yield curve typically occurs when long-term interest rates decline more rapidly, or short-term rates experience a more pronounced increase. This shift often stems from investor apprehension regarding the economic trajectory, possibly due to expectations of subdued inflation or impending interest rate adjustments by the Federal Reserve. For instance, if the Federal Reserve opts to elevate its short-term target rate—as seen during the 2022-2023 period in response to inflationary pressures—short-term rates may surge, while long-term rates remain relatively stable or rise modestly. This divergence effectively flattens the curve, as the premium for long-term lending diminishes.
The Federal Reserve, through its manipulation of the federal funds rate, wields significant influence over borrowing costs across the economy. Changes to this overnight lending rate for banks can ripple through the financial system, affecting a spectrum of interest rates. While an increase in the federal funds rate invariably boosts short-term rates, its impact on long-term rates is less predictable. Sometimes, both segments of the curve ascend in tandem; at other times, only short-term rates rise, leading to a flattened curve. This latter scenario often unfolds when market participants foresee a brief cycle of rate hikes, followed by potential cuts as economic growth falters.
For lenders, particularly banks, a flattening yield curve can compress profit margins. Banks typically thrive when the long-term rates at which they lend money significantly exceed the short-term rates at which they borrow. Consequently, a narrowing spread between these rates can lead to reduced profitability and a more conservative approach to extending credit, a sentiment often amplified by the specter of an impending economic slowdown. However, this dynamic isn't always straightforward. Many loans are structured with variable rates tied to short-term benchmarks, and banks often benefit from lower borrowing costs from savers, which can mitigate some of the negative effects of a flat yield curve.
In contrast to a flat or inverted curve, a healthy yield curve typically exhibits an upward slope, signaling robust economic conditions and positive growth expectations. In such a scenario, bond yields progressively increase with longer maturities. For example, a two-year bond might yield 1%, a five-year bond 1.8%, a ten-year bond 2.5%, a fifteen-year bond 3.0%, and a twenty-year bond 3.5%. A steepening curve generally indicates strong economic expansion, anticipating higher inflation and rising interest rates, while a flattening curve suggests caution and uncertainty.
In this environment, investors might consider adopting a "barbell strategy." This approach involves allocating investment capital to both very short-term and very long-term bonds, effectively balancing immediate liquidity with the potential for higher returns from distant maturities. For instance, an investor might split their fixed-income portfolio equally between U.S. Treasury 10-year notes and U.S. Treasury two-year notes. This strategy offers flexibility to react to bond market shifts, though it carries risks, particularly if long-term rates experience a rapid, significant increase.
The yield curve serves as a critical indicator for investors, signaling market expectations for future interest rates, economic growth, and inflation. Its shape—whether normal, flat, or inverted—provides valuable insights that can inform investment decisions. While an inverted curve is often seen as a harbinger of recession, a flat curve indicates a period of economic ambiguity, necessitating careful consideration of asset allocation and risk management.
The flat yield curve is a complex yet vital economic signal. Its presence compels investors, lenders, and policymakers to reassess their strategies and prepare for potential shifts in the economic landscape. By understanding its causes and implications, market participants can make more informed decisions, mitigating risks and identifying opportunities in a dynamic financial environment.