The landscape of U.S. home equity is undergoing a subtle yet significant transformation. Recent data indicates that the typical American homeowner, equipped with a mortgage, commands an impressive average of over $300,000 in home equity. This figure represents a remarkable surge since the onset of the COVID-19 pandemic, contributing to a national equity total that now stands at an astounding $17.5 trillion.
Report Highlights Moderating Market and Regional Disparities in Home Equity
According to the latest Q2 2025 home equity report from Cotality, a prominent analytics firm, the average mortgage-holding homeowner experienced a modest decrease of approximately $9,200 in their equity over the past year. Nevertheless, this cohort still retains a substantial $307,000 in accumulated equity, marking the third-highest quarterly sum ever recorded within Cotality's comprehensive dataset.
The report emphasizes the importance for homeowners to closely monitor the evolving market dynamics, despite the seemingly minor adjustments. After two consecutive years of robust growth—$25,000 in 2023 and an additional $4,500 in 2024—the pace of equity accumulation has now decelerated.
This moderation in equity levels has led to a slight uptick in the proportion of 'underwater' homes, where the property's value falls below its outstanding mortgage balance. As of the second quarter of 2025, 2% of mortgaged properties were in negative equity, a modest rise from 1.7% observed a year prior.
Looking ahead, Cotality projects a national home price increase of 3% over the next twelve months. While this forecast suggests a slower rate of appreciation compared to preceding years, it remains an encouraging sign for existing homeowners. The firm predicts minimal shifts in the percentage of homes with negative equity, noting that a 5% increase in home prices could restore equity for 144,000 properties, whereas a 5% decline might push an additional 242,000 into negative territory.
Selma Hepp, Cotality's chief economist, highlighted that the current rate of home price appreciation in 2025 is the slowest since 2008. Yet, even in areas experiencing price reductions, such as Washington, D.C., and Florida, home equity levels persist at historically elevated benchmarks. For instance, homeowners in these regions still possess an average of $350,000 and $290,000 in equity, respectively.
Hepp further elaborated that with the reduced tempo of appreciation, seasonal price fluctuations will exert a more noticeable influence on equity changes. The recent declines also underscore the strategic benefits of accessible equity, as some homeowners are leveraging these assets for diverse financial objectives.
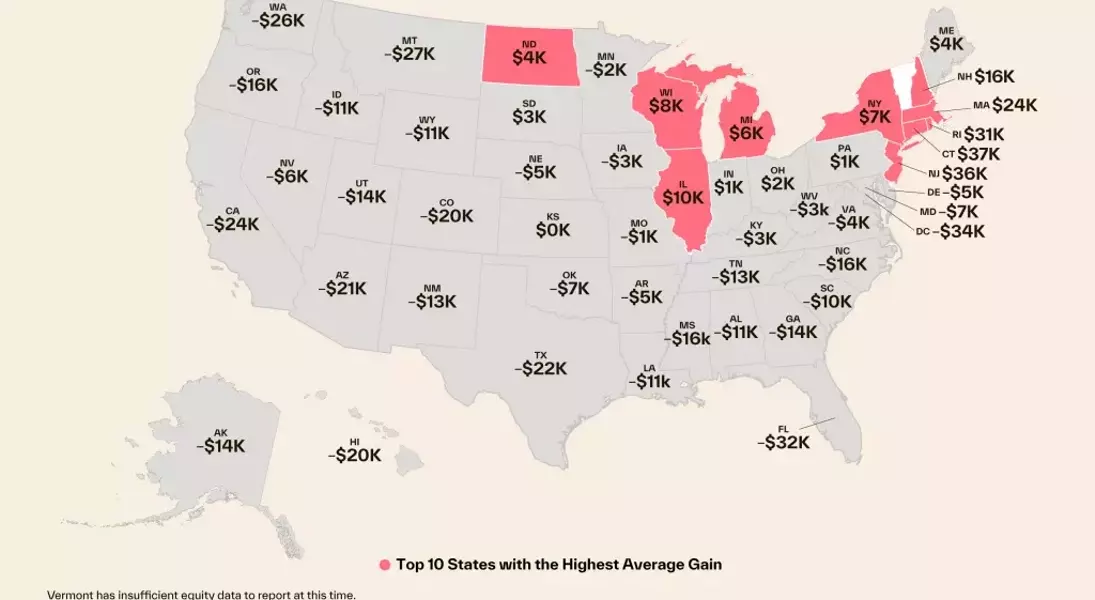
Analyzing the data geographically, the Northeast states demonstrated the most significant equity gains in the year leading up to Q2 2025, with Connecticut recording an impressive $37,400 increase per homeowner, followed by New Jersey at $36,200, and Rhode Island at $31,200. Midwestern states, including Illinois, Wisconsin, Michigan, and North Dakota, also reported positive growth. Conversely, other parts of the nation observed a decrease in equity levels, notably the District of Columbia (down $34,400), Florida (down $32,100), and Montana (down $26,900).
Among the major metropolitan areas, Boston led with the largest year-over-year equity growth, at $25,600 per homeowner. San Francisco, however, experienced the most substantial decline, losing $31,700, although its negative equity share remained impressively below 1%.
This report underscores a pivotal moment for the housing market. While overall equity remains robust, the moderating growth and slight increase in negative equity call for careful consideration from homeowners and policymakers alike. The data offers a nuanced view, revealing a market that, despite slowing, retains significant value and offers opportunities for strategic financial planning, especially given the regional disparities in performance. Understanding these trends is crucial for navigating the evolving economic landscape and making informed decisions regarding property investments.
