

Unraveling the Trends in Residential Construction Geography
Single-family
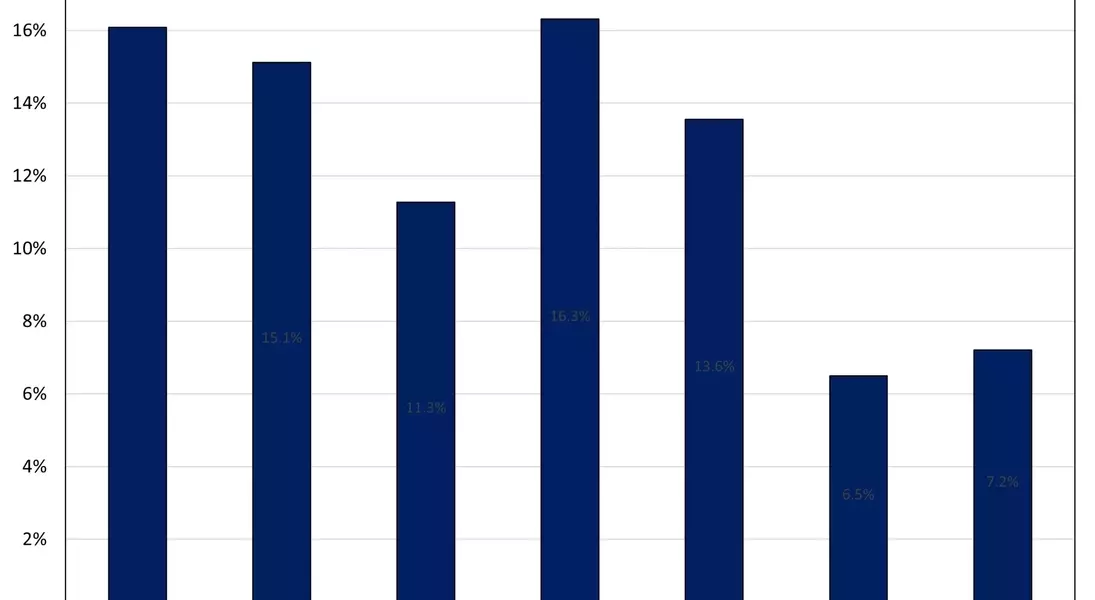
In the third quarter, all HBGI-tracked geographies witnessed growth in single-family starts. Permit data, which has been consistently higher than last year, is driving this upward trend. Among the HBGI geographies, small metro core counties registered the highest growth of 16.3% on a year-over-year four quarter moving average basis. On the other hand, micro counties had the lowest growth at 6.5%. This shows the varying dynamics within different geographical areas.
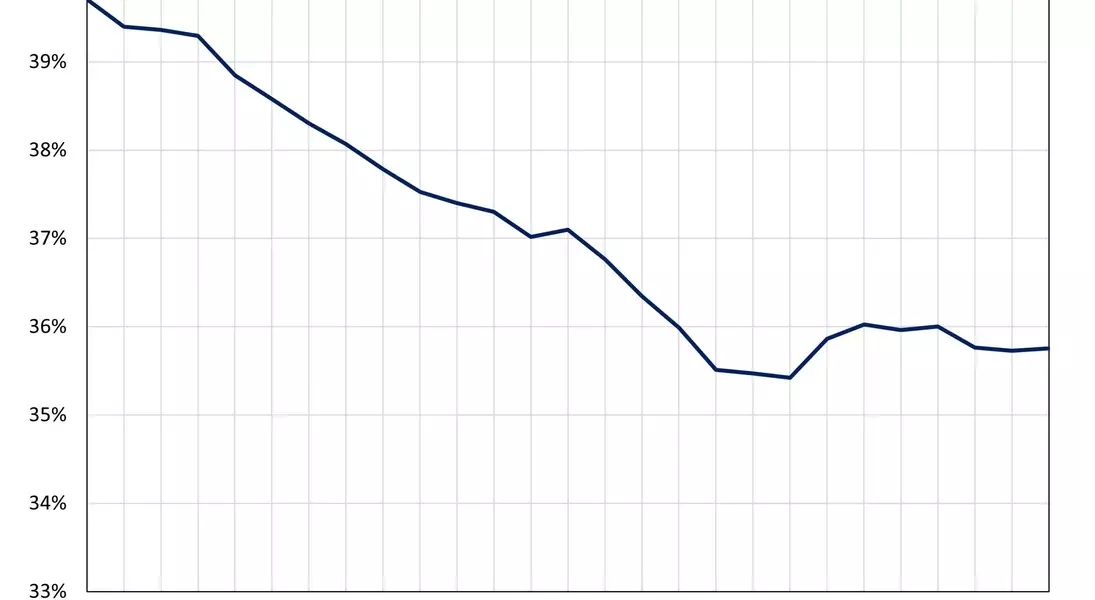
Furthermore, new analysis reveals that counties with the highest population density have seen a decline in their market share for single-family construction. In 2018's first quarter, these high-density counties constituted nearly 40% of single-family construction on a four-quarter moving average basis. However, since then, their share has fallen to 36%. This trend predates the COVID pandemic and has continued even after it.
Multifamily
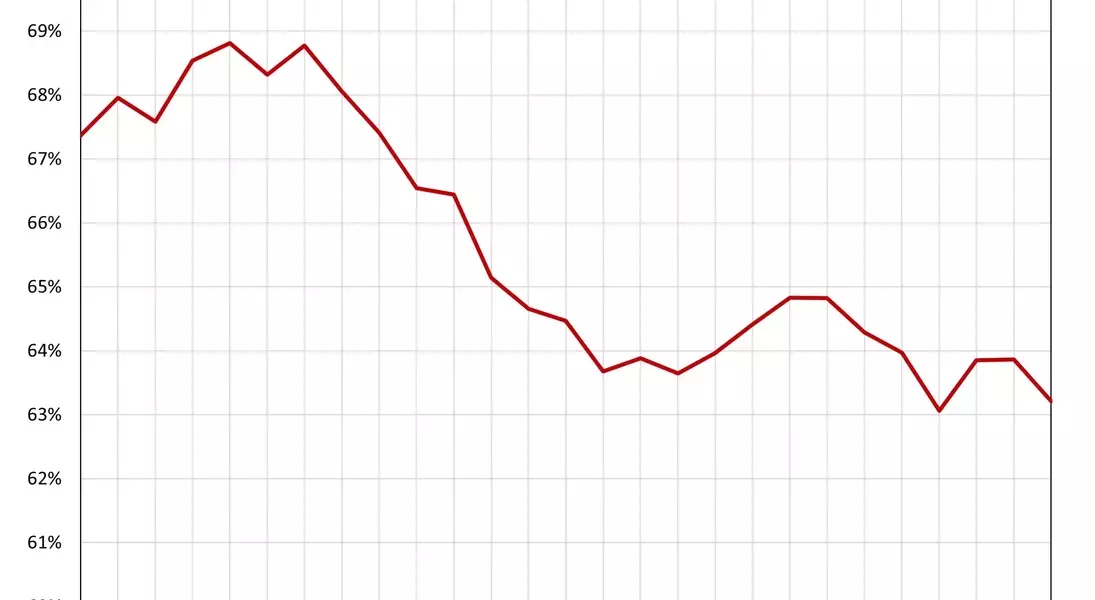
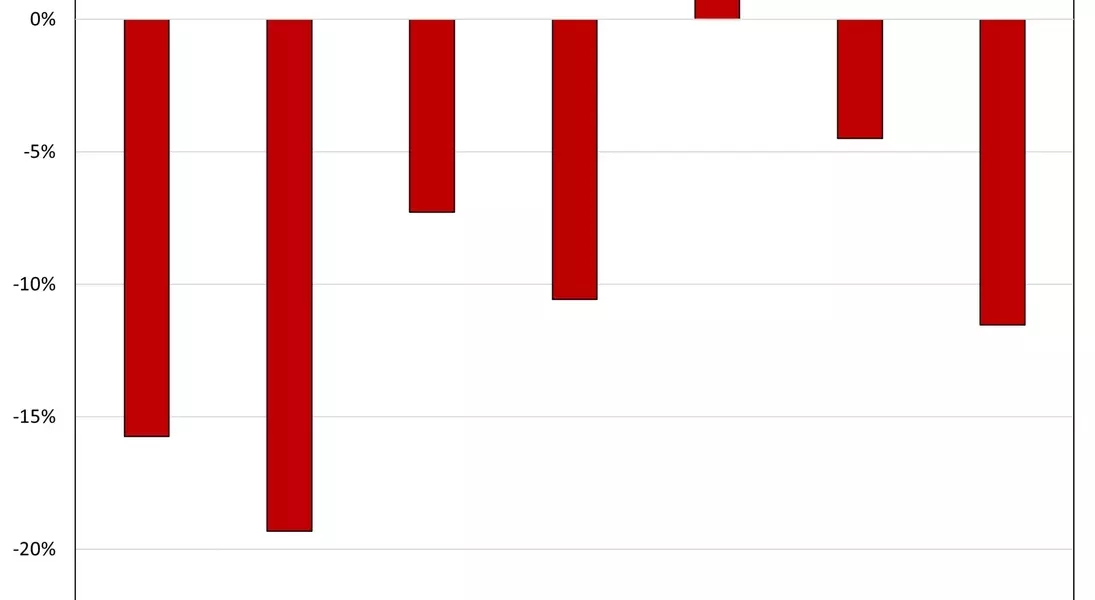
In the multifamily sector, the HBGI year-over-year growth showed declines in the third quarter for all but one geography. Small metro outlying counties witnessed a 2.3% increase on a year-over-year four quarter moving average basis, with more than 9,000 permits authorized. However, large metro suburban counties saw the largest decline of 19.3% during the same period. Despite high-density areas still making up a majority of the multifamily market (67.4% in 2018's first quarter and now 63.2%), there has been a significant shift during the pandemic, with a 3.8 percentage point drop over a two-year period.
Currently, with over 800,000 multifamily units under construction and higher interest rates, multifamily construction remains relatively subdued compared to last year. The HBGI data for the third quarter of 2024, along with an interactive HBGI map, can be accessed at http://nahb.org/hbgi.
