Fibonacci analysis employs an ancient mathematical sequence to forecast market turning points and price fluctuations. By applying Fibonacci ratios to financial charts, traders can accurately pinpoint potential support and resistance zones. This guide introduces two powerful methodologies, the Fibonacci Flush and the Parabola Pop, designed to refine trading entries and exits for increased profitability. These strategies, combined with technical indicators such as retracement charts, offer a structured framework for anticipating market behavior and achieving superior trading results.
Fibonacci analysis, rooted in an 800-year-old mathematical sequence, provides a robust framework for anticipating price movements and market reversals. Leonardo de Pisa, famously known as Fibonacci, discovered this logical sequence that manifests ubiquitously in nature and art, and intriguingly, it accurately describes intricate relationships within market trends. These numbers help define the extent of market pullbacks to previously traded levels. The core Fibonacci sequence, starting with 1 (1+1=2, 1+2=3, 2+3=5, and so on), generates repeating ratios that are fundamental to modern financial market analysis. Key retracement levels like .382, .50, and .618 form the bedrock of Fibonacci grids in trading software, with .214 and .786 levels gaining prominence during periods of heightened market volatility. Traders can simply apply this grid to significant price highs and lows to uncover crucial turning points. However, a deeper understanding reveals that market trends are harmonic, comprising smaller and larger waves with distinct price directions. This complexity becomes evident when analyzing different timeframes, such as shifting from daily to weekly charts or delving into 60-minute or 15-minute charts for more granular insights into market dynamics.
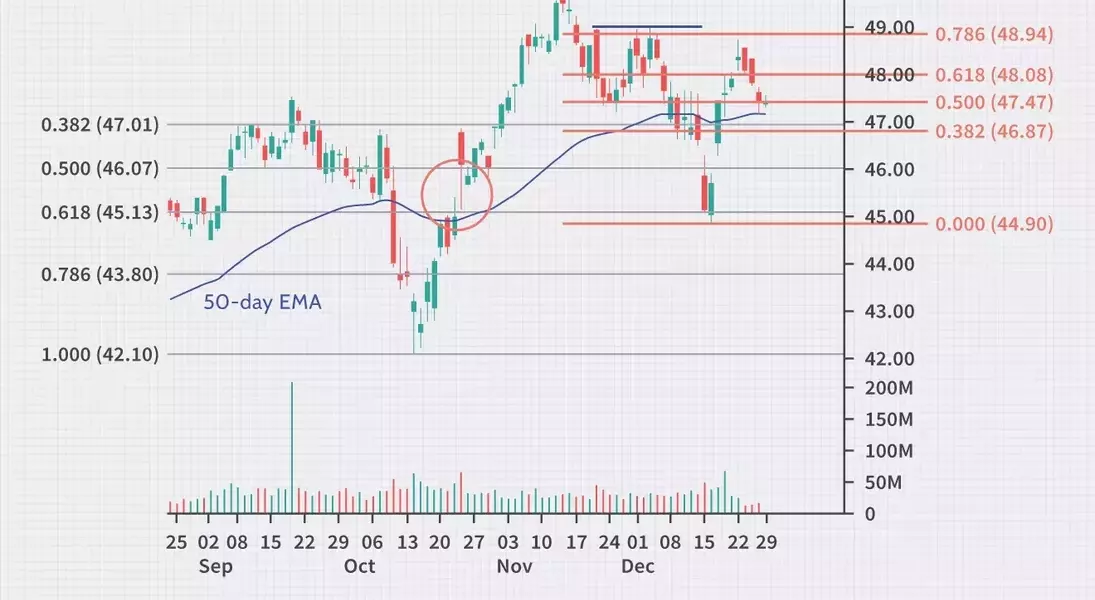
To enhance trading outcomes, consider integrating two or more timeframes in your Fibonacci analysis. Swing traders often benefit from combining daily and 60-minute charts, while market timers can gain significant edge by examining daily and weekly charts simultaneously. The convergence of key Fibonacci levels across these different timeframes uncovers subtle support and resistance zones that are invaluable for precise entry, exit, and stop-loss placements. For instance, observing Microsoft's stock in October 2014, a sharp rally from a low of $42.10 to $50.05 was followed by a pullback. Initially, the price found support at the 38.2% retracement level for several sessions before a December gap-down led it to the 61.8% Fibonacci retracement. This level proved to be a critical tradable low, preceding a strong recovery that halted at the 78.6% retracement. This example underscores how effective Fibonacci analysis becomes when integrated with other technical indicators like price gaps, moving averages, and established highs and lows.
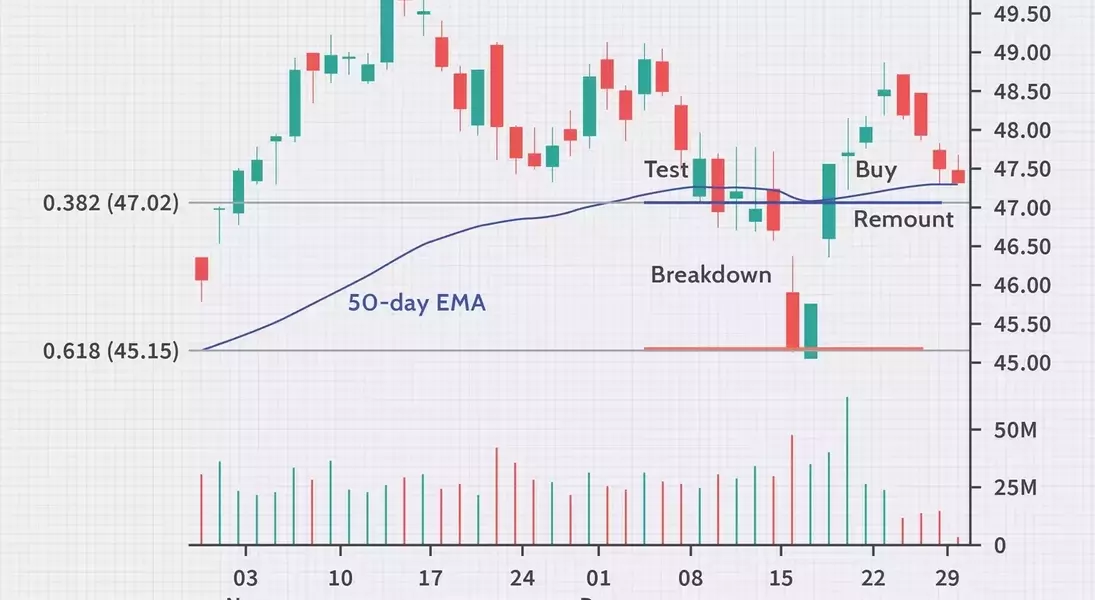
The Fibonacci Flush strategy offers a sophisticated method for identifying low-risk entry points. In the Microsoft example, after the price held at the 38% retracement, a sudden downward gap trapped many investors, leading to a volatile low at the 62% level. While buying at this support level might seem logical, it carries inherent risk due to the potential for further breakdown. However, when the price subsequently surges back above the 38% retracement, it signifies a reinstatement of support, triggering a 'Fibonacci Flush' buy signal. This indicates that positions taken around $47 are likely to yield reliable profits. This dynamic effectively filters out hesitant shareholders and attracts new capital, allowing for lower volatility trades and reinforcing the tendency for tested, broken, and then re-established support levels to hold firm.
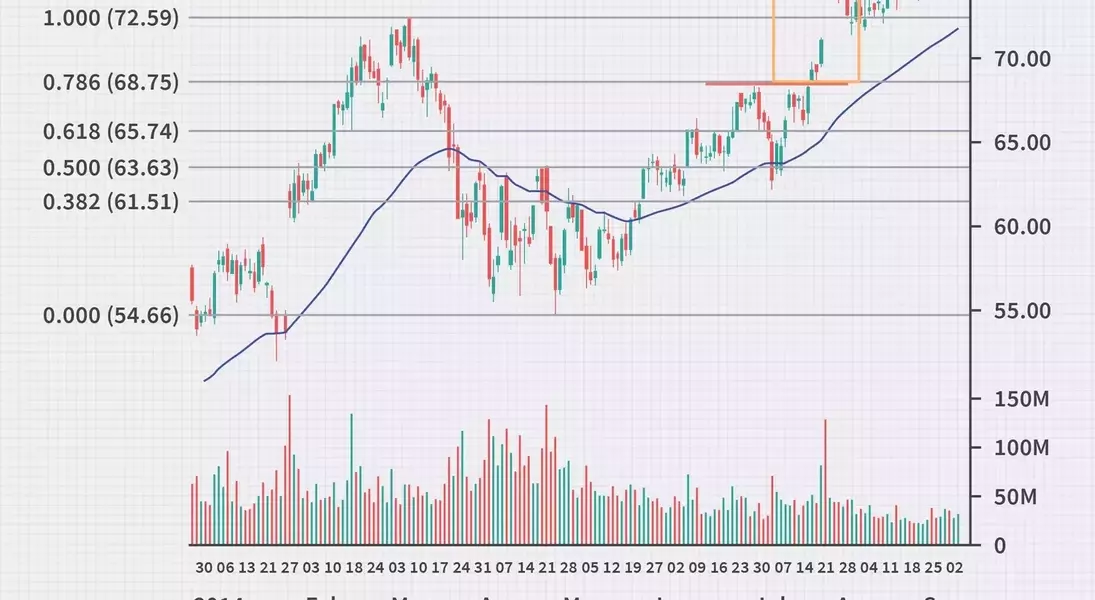
The Parabola Pop strategy capitalizes on the 78.6% retracement level, which often acts as the final harmonic threshold before an asset completes a full 100% price swing. A breakthrough above this level in an uptrend, or a breakdown in a downtrend, typically signals an extended move towards the last swing high or low. This provides an opportunity for significant gains over a relatively short period. For example, after Meta's stock (formerly Facebook) peaked at $72.59 in March 2014 and corrected to the mid-$50s, its subsequent rally stalled at the 78.6% retracement level of $68.75 for three weeks. When the stock finally broke above this resistance on July 21, it rapidly completed the remaining 21.4% of the price swing in just four sessions. This rapid vertical movement, akin to a 'parabolic tendency,' is a key feature of this strategy, often observed across various timeframes. While not a guaranteed outcome, this tendency offers a distinct edge for traders.
Effective utilization of these Fibonacci techniques demands a disciplined approach and a tolerance for short-term market fluctuations. Traders who maintain consistency and adhere to their strategies are better positioned to capitalize on significant market shifts revealed by Fibonacci patterns.